Parameters:
figsize(float) : The figure size in inches. The apsect ratio is set to 1. The x or y axis of your plot will be adjusted accordingly.
Usage Example
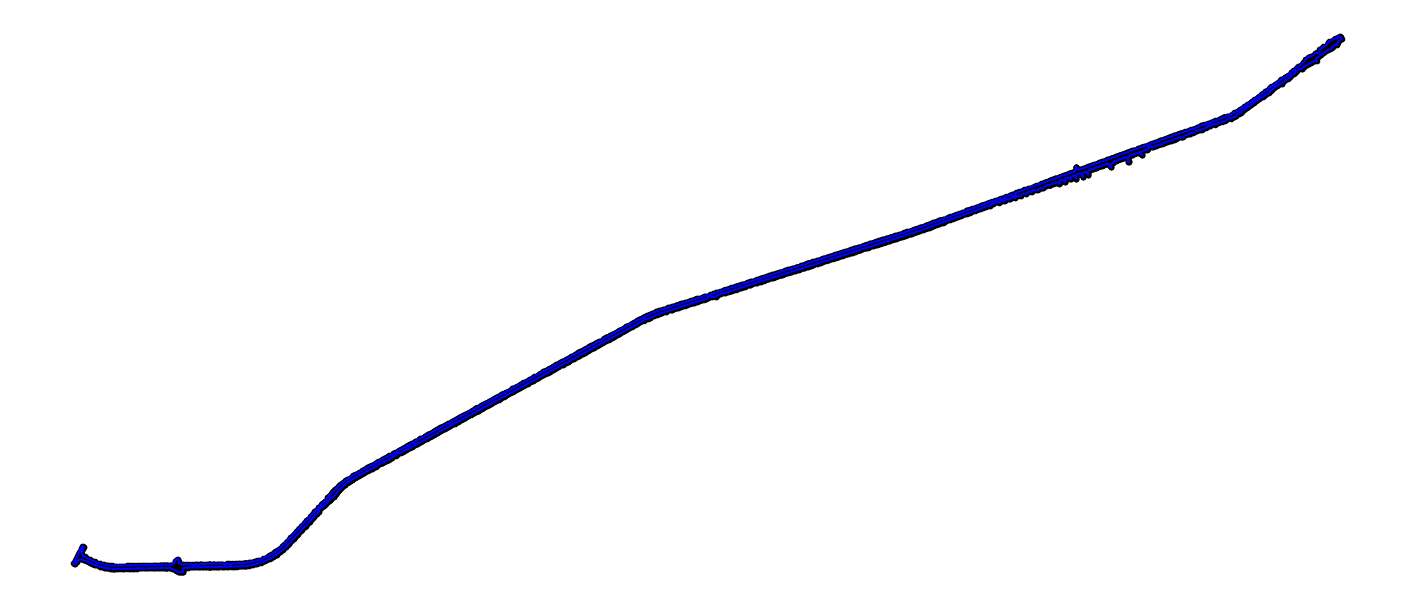
Example of a real strip survey from on a section of road.
withopen('../examples/BANDELIER8.TXT') as source: points =list()for i, pt inenumerate(source): items = pt.split()if i <=5:print(items) x, y, z =float(items[1]), float(items[2]), float(items[3]) points.append((x, y))print()print('Number of points in the survey:', len(points))
['STN9', '88609.53', '-2573311.58', '1071.33']
['FE1000', '88611.22', '-2573309.87', '1071.30', 'Fenline']
['FE1001', '88612.12', '-2573310.23', '1071.40', 'Fenline']
['FE1002', '88624.42', '-2573296.98', '1071.45', 'Fenline']
['FE1003', '88636.30', '-2573283.87', '1070.87', 'Fenline']
['FE1004', '88651.24', '-2573273.17', '1070.39', 'Fenline']

Number of points in the survey: 12275
The tol parameter in the calculatehull method is in this case expressed as metres. All boundary edges greater than this will be investigated for possible removal.
Boundary edges longer than this can possibly remain if the the triangle has two boundary edges already. No points will be left “stranded” outside the hull.
Depending on the input points the tol parameter can be in degrees or feet as well.
ch = ConcaveHull()ch.loadpoints(points)ch.calculatehull(tol=35)print()print('Number of points on the boundary:', len(ch.boundary_points()))print()
Number of points on the boundary: 1675

CPU times: user 301 ms, sys: 7.25 ms, total: 308 ms
Wall time: 307 ms
ch.plot(figsize=18)
If there is an uncertainty on which value to use for the tol parameter the estimate method can be used to provide a starting value.
estimate = ch.estimate()print(estimate)
30.13064834845798
ch.calculatehull(tol=estimate)print()print('Number of points on the boundary:',len(ch.boundary_points()))print()